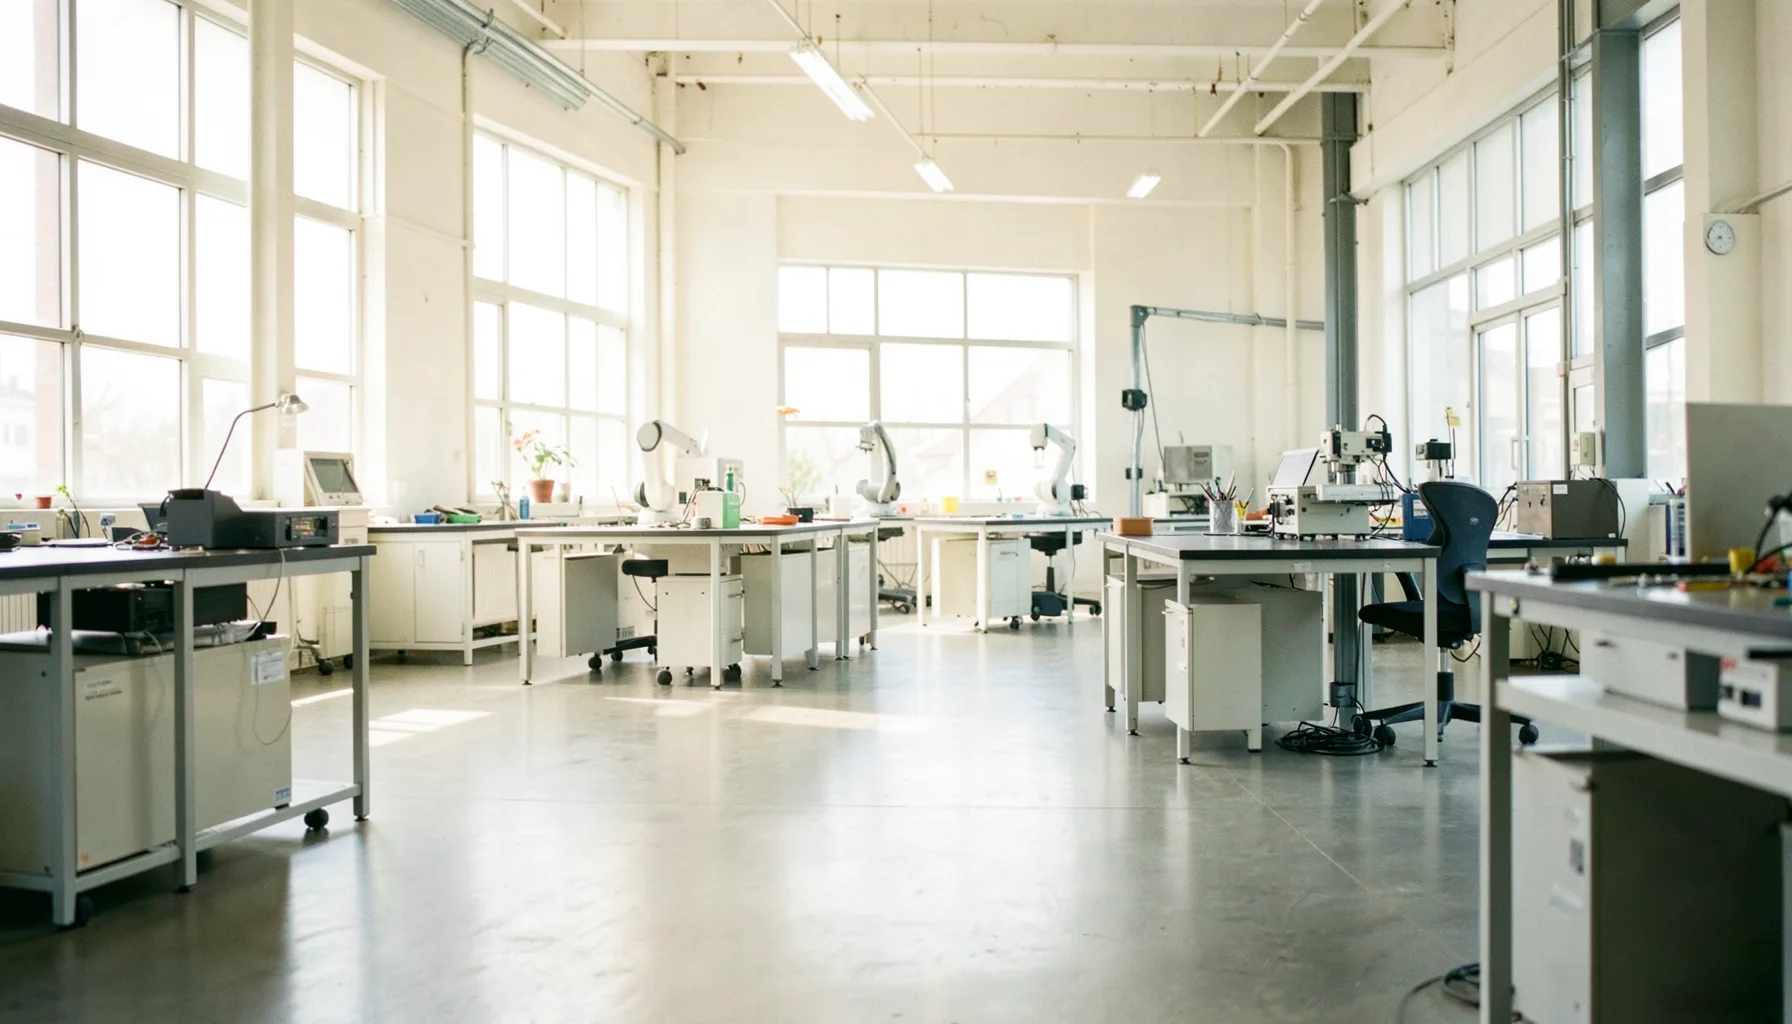
Mapping Your Production Floor Before You Automate
Australian manufacturers from Geelong to Bunbury are weighing robotics and digital tools as labour costs climb and skilled fitters grow scarce. The temptation is to sign a contract, install a cobot, and hope productivity gains arrive in the next quarter. That rarely works. What separates a smooth automation rollout from a costly write-off is the unglamorous work done beforehand: sketching your factory floor on paper before a single sensor is bolted to a machine.
A floor map is more than a layout drawing. It records how material enters, where it queues, who handles it, and where it exits as a finished good. Without that picture, automation projects become a guessing game, and guesses tend to favour vendors rather than operators.
The phrase "measure twice, cut once" applies here more than anywhere in the factory. Local firms in food processing, metal fabrication, and pharmaceutical packaging have all learned that automation bolted onto a chaotic workflow simply accelerates the chaos. Spend a few days on the floor with a clipboard and you will see problems no spec sheet ever mentioned.
This guide walks through a practical approach to mapping your shop. Whether you run a 12-person workshop in Dandenong or a multi-shift plant in the suburbs of Perth, the same logic applies: understand the terrain before you build the road.
Why the floor map is your automation blueprint
Think of the map as the foundation under every other decision. Once drawn, you can overlay proposed robot paths, conveyor additions, or inspection stations without guessing where existing pinch points sit. It also gives your technology provider a common reference, so their proposal lines up with your reality rather than their brochure.
A clear map helps your team see the change coming. Operators who watch you redraw their workspace become participants in the redesign, not victims of it. That buy-in matters more than any software feature, especially in tight labour markets where losing a good operator can set a business back months.
The map also exposes waste. Material travelling across the shop floor three times before reaching packing rarely shows up in a spreadsheet. Once visible, automation targets tend to choose themselves, and the business case becomes something your accountant can defend.
Walking the shop floor with a fresh pair of eyes
Start by physically walking the space, ideally with someone who has never worked in it before. Take a manager from accounts, an engineer from head office, or a trusted supplier in tow. People outside the daily routine spot things insiders have stopped noticing, like the pallet jack that always parks in the same spot or the forklift path that crosses a pedestrian walkway six times an hour.
Bring a stopwatch. Time how long a job sits waiting between operations. Australian factories, particularly in regional centres, often run lean shifts, so a 20-minute idle wait during peak production can cascade into overtime the following week. Document these idle periods; they are the first candidates for automation.
Photograph everything. Snap the labels on machines, the markings on the floor, the power outlets, the compressed air lines, the Wi-Fi dead zones. You will be surprised how often these details come up in vendor conversations, and a photo resolves arguments in seconds. Walk the floor at different times of day too. The morning setup looks very different from the afternoon rush.
Charting workflows, handoffs, and bottlenecks
Once you have walked the floor, turn those observations into a process diagram. Use simple shapes: a square for each operation, an arrow for material flow, a diamond for a decision point. Software tools or a humble whiteboard both work. The goal is clarity, not elegance.
Mark the queues. Every place work piles up is a constraint. Sometimes the queue exists because a worker is multitasking; sometimes because the next machine is the wrong size for the job. Either way, a queue is rarely fixed by throwing technology at it. Sometimes the right answer is a rearranged layout or a relocated tool, and only afterwards does automation make sense.
Pay close attention to handover points between humans and machines. These are the spots where automation often delivers the biggest wins, but also where projects stall. A Victorian textile supplier, for instance, found that an automated cutter plugged into existing cutting tables, and the details are worth a look in this fabric cutting case study. Their experience shows how upstream mapping made downstream automation dramatically easier to commission.
Spotting the processes ripe for automation
Not every process should be automated, and not every process should be left alone. The mapping exercise helps you draw a line between tasks that benefit from a robot or a software tool and tasks best left in human hands. Repetitive, high-volume, physically demanding work sits at the top of the list. So does work where consistency matters more than creativity.
Look for tasks where the cost of error is high but the human error rate is also high. Inspection, label verification, and data entry all fall into this category. They are also tasks where a digital solution can often be tested in a small corner of the factory before a wider rollout.
Be careful not to confuse automation with digitalisation. Some processes, like answering the same five customer questions over the phone each morning, do not need a robot on the floor. They need a simple digital tool that takes the load off the front desk. If you want a sense of how a small business tackled this without heavy capital outlay, this chatbot setup guide shows a path that pairs neatly with a broader automation plan.
Matching technology providers to your floor reality
A floor map in hand, you are ready to talk to providers. Vendors who ask to see your map before pitching a solution are usually the ones worth listening to. Vendors who wave a generic deck and ask about your budget first are usually selling you yesterday's product.
Take two or three providers through the same walk of the floor using the same script. Compare their questions as well as their answers. The provider who notices your existing MES, your oddly placed emergency stop, or your undersized air compressor is the provider who has actually read the room.
Consider providers with experience in Australian conditions: heat, dust, and the occasional cyclonic power surge. A robot that performs beautifully in a climate-controlled European factory may not enjoy a 42-degree day on a slab in Wetherill Park. Ask for local references and visit at least one site unannounced.
Funding the change through subsidy and support programs
Capital is tight for most Australian SMEs, and a single cobot installation can chew through six figures before the first programmed cycle. Subsidy and grant programs exist to absorb part of that risk, but they typically require a clear written case, and that case starts with the floor map.
When you apply for funding, your map becomes evidence. It shows the funder that you understand the problem, have considered alternatives, and that the proposed solution fits your specific environment. Applications with vague claims are routinely knocked back. Applications with a marked-up floor plan showing the bottleneck and the proposed relief are taken seriously.
Pair the map with a simple payback calculation: cost of automation divided by monthly labour or waste savings. Include a sensitivity row for downtime and training. Programs like the federal Modern Manufacturing Initiative, AMGC sector growth projects, and state schemes such as Invest Victoria or the NSW Investment Boost all reward applicants who bring preparation, not just enthusiasm.
Ready to take the next step? The Shinagawa City program connects Australian businesses exploring automation with a vetted network of Japanese technology providers and walks eligible applicants through the subsidy process. Register your interest today and request a floor-mapping consultation tailored to your site, your sector, and the realities of running production in this part of the world.